
Key Takeaways
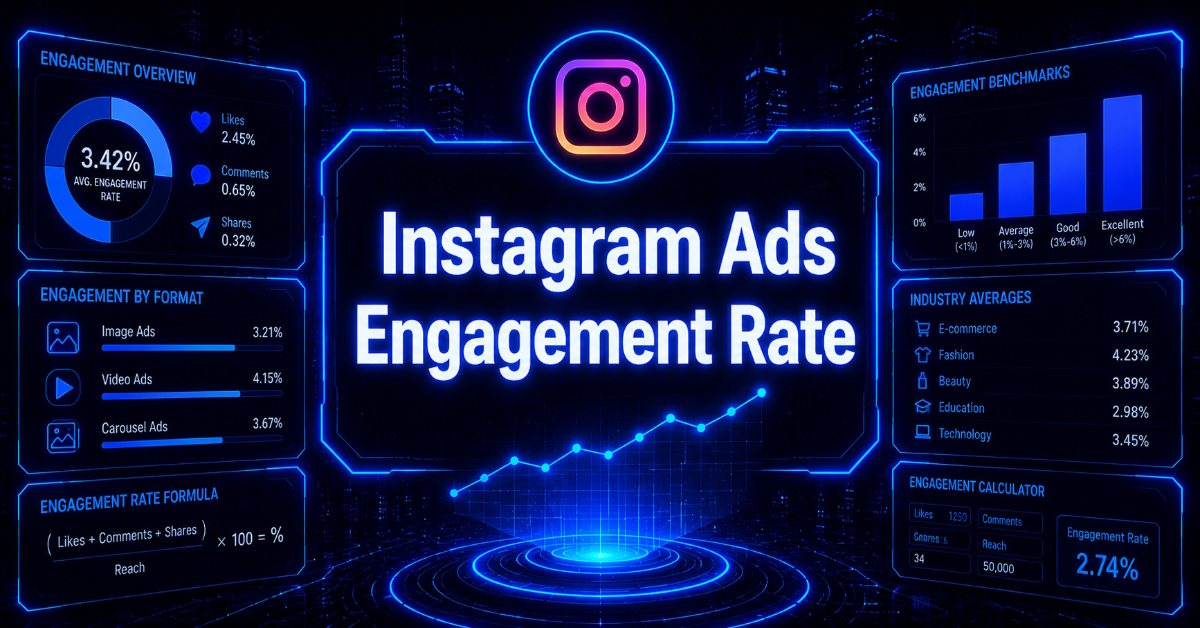
- Instagram ads engagement rate averages 0.48% per post across the platform in 2026, with a median around 0.36% and a top-quartile threshold of 1.05%. Format and industry pull individual ads significantly above or below these benchmarks.
- Carousels lead by format at 0.52%, with Reels close behind at 0.50%, and static images trailing at 0.35% and declining. Reels reach roughly 2.25 times more users than single-image posts, making them the strongest format for combined reach and engagement.
- Three formulas exist for calculating engagement rate. Reach-based is the most accurate for paid campaigns, impressions-based suits CPM bidding structures, and followers-based is best reserved for organic content since paid ads regularly reach non-followers at scale.
- Industry benchmarks matter more than platform averages. A 0.6% engagement rate is below average for higher education advertisers but above average for finance brands, making peer comparison within your niche a more useful performance standard.
- GetHookd helps media buyers lift Instagram ad engagement by analyzing 65 million ads across Meta to surface proven hooks, scaling creatives, and AI-generated ad variations.
The Quick Answer on Instagram Ad Engagement
Instagram ads engagement rate currently averages 0.48% per post across the platform, with format and industry pulling individual ads above or below that line. You calculate it by dividing total engagements (likes, comments, saves, shares) by reach, impressions, or follower count, then multiplying by 100. That single percentage tells you if your creative is earning interaction or simply burning ad spend.
Knowing your benchmark is only half the job. The other half is knowing which creatives are actually clearing it in your niche, which is where GetHookd comes in. By analyzing over 65 million Meta ads, GetHookd shows media buyers exactly which hooks and formats are scaling right now, so you can build from evidence rather than trial and error.
This guide covers current benchmarks, calculation methods, and a practical calculator walkthrough.

GetHookd: Turn Competitor Intelligence Into Your Next Winning Ad
GetHookd reveals which ads your competitors are actively scaling—not just running. Spy on their best-performing creatives, landing pages, and traffic strategies, then turn proven concepts into testable campaigns in seconds with AI-powered script generation and creative cloning.
What You Get:- ✓ Brand Spy to decode competitor ad strategies in real-time
- ✓ AI script generation and ad cloning for instant variations
- ✓ Performance scoring based on actual ad behavior, not vanity metrics
- ✓ Creative Analyzer to identify and scale your top performers
What Is Instagram Ads Engagement Rate?
Instagram ads engagement rate is a percentage that shows how often your paid audience interacts with a specific creative. Engagements include likes, comments, saves, shares, and link clicks, with sticker taps and replies factored in for Stories placements. The metric reveals whether your ad is earning real interest or burning impressions.
For paid campaigns, engagement rate is often more telling than reach or impressions alone. A high-impression ad with low engagement signals weak creative, poor targeting, or both. Strong engagement usually correlates with lower Cost Per Mille (CPM) because Meta rewards interactive ads with cheaper distribution and broader auction reach.
Marketers track this metric for two main reasons. First, it benchmarks creative quality against industry standards and your own historical performance. Second, it informs ad rotation and creative refresh cycles before fatigue inflates costs.

Average Instagram Ads Engagement Rate in 2026
The current Instagram engagement rate sits at roughly 0.48% per post across all content, based on analysis of 35 million Instagram posts collected through 2025. Independent industry data shows a median of around 0.36% and a top-quartile threshold of 1.05% across 14 verticals, which gives paid advertisers a useful upper benchmark for healthy creative.
Paid ad performance varies by placement and creative format. Feed ad click-through rates typically range from 0.22% to 0.88%, while Story ad click-through rates range from 0.33% to 0.54%. These CTRs often track closely with engagement signals on the same placements.
Average Engagement Rate by Content Format
Carousels lead Instagram engagement at roughly 0.52% in Q1 2026, with Reels close behind at 0.50%. Static image engagement keeps sliding and now sits at 0.35% in Q1 2026, reflecting a 17% year-over-year decline as users shift toward swipeable and short-form video content.
Format choice also drives reach economics, not just per-post interaction. Reels reach roughly 2.25 times as many users as single-image posts and 1.36 times as many as carousels, making them the strongest reach driver, even when carousels edge them out on raw engagement.
Average Engagement Rate by Industry
Engagement rates shift heavily by vertical. Higher education brands routinely post the strongest Instagram engagement, with sports teams and nonprofits close behind. Fashion, health and beauty, and financial services trail the all-industry median, often by a wide margin.
A practical rule of thumb is to compare paid engagement with brands in your niche rather than cross-industry averages. A 0.6% engagement rate is below average for higher education advertisers but solidly above average for a finance brand. Setting the right peer comparison prevents you from chasing benchmarks that don’t apply to your audience or offer.
How to Calculate Instagram Ads Engagement Rate?

Engagement Rate by Reach
This is the most common formula for paid Instagram ads because reach reflects the number of unique users who actually saw the creative. It also adjusts for viral distribution beyond your follower base.
- Formula: Engagement Rate = (Total Engagements / Reach) × 100
Example: A Reel ad with 1,200 likes, 90 comments, 70 shares, and 40 saves (1,400 total engagements) that reached 70,000 unique users posts a 2% engagement rate. That figure clears the platform average and signals a healthy creative.
Engagement Rate by Impressions
This formula works best for CPM-based campaigns where you pay per 1,000 impressions. It shows how often each display generates an interaction across all viewing sessions, including repeat views.
- Formula: Engagement Rate = (Total Engagements / Impressions) × 100
The number will run lower than the reach-based rate because impressions count every view, not unique viewers. Most advertisers running awareness campaigns prefer this formula since it ties engagement directly to the CPM bidding structure they are paying against.
Engagement Rate by Followers
This formula divides engagements by total follower count, regardless of how many followers actually saw the post. It is the simplest method, but often misleading for paid ads, since followers are not your only audience.
- Formula: Engagement Rate = (Total Engagements / Followers) × 100
Use this for organic content or quick competitor benchmarking. Avoid it for paid performance reporting, since ads frequently reach non-followers at scale, which distorts the math.
Instagram Ads Engagement Rate Calculator: Step-by-Step Example
Here is a simple way to calculate engagement rate for any Instagram ad without external tools.
- Pull total likes, comments, saves, and shares from Meta Ads Manager or Instagram Insights for your selected date range.
- Add all interactions together to get the total engagements for the ad.
- Pick your denominator based on goal: reach (most accurate for paid), impressions (for CPM bids), or followers (for organic comparison).
- Divide total engagements by your chosen denominator.
- Multiply the result by 100 to get the percentage.
Calculation Examples
- Reach-based example: Your Reels ad has 850 likes, 60 comments, 30 shares, and 25 saves, totaling 965 engagements. It reached 48,000 unique users. The calculation is (965 / 48,000) × 100 = 2.01%, well above the platform average.
- Impressions-based example: The same ad served 72,000 impressions because users saw it multiple times. The math becomes (965 / 72,000) × 100 = 1.34%. The lower result is expected since impressions always exceed reach when ads cycle through the same audience.
- Follower-based example: If the brand has 20,000 followers, the calculation is (965 / 20,000) × 100 = 4.83%. The number looks higher, but it overstates engagement on a paid ad because most interactions came from non-followers. This is why reach is the cleaner denominator for paid campaigns.
Free engagement calculators automate the math when you connect a public profile or paste in numbers. Use them for quick checks, but pull raw data from Ads Manager for accuracy on paid campaigns and rolling reports.
Turning Instagram Ads Engagement Rate Into Action with GetHookd
Instagram ad engagement rate is only useful when you track it consistently, choose the right formula for your campaign type, and compare it against peers in your niche rather than platform-wide averages. Getting those three things right is what separates a vanity stat from a decision that actually moves your results.
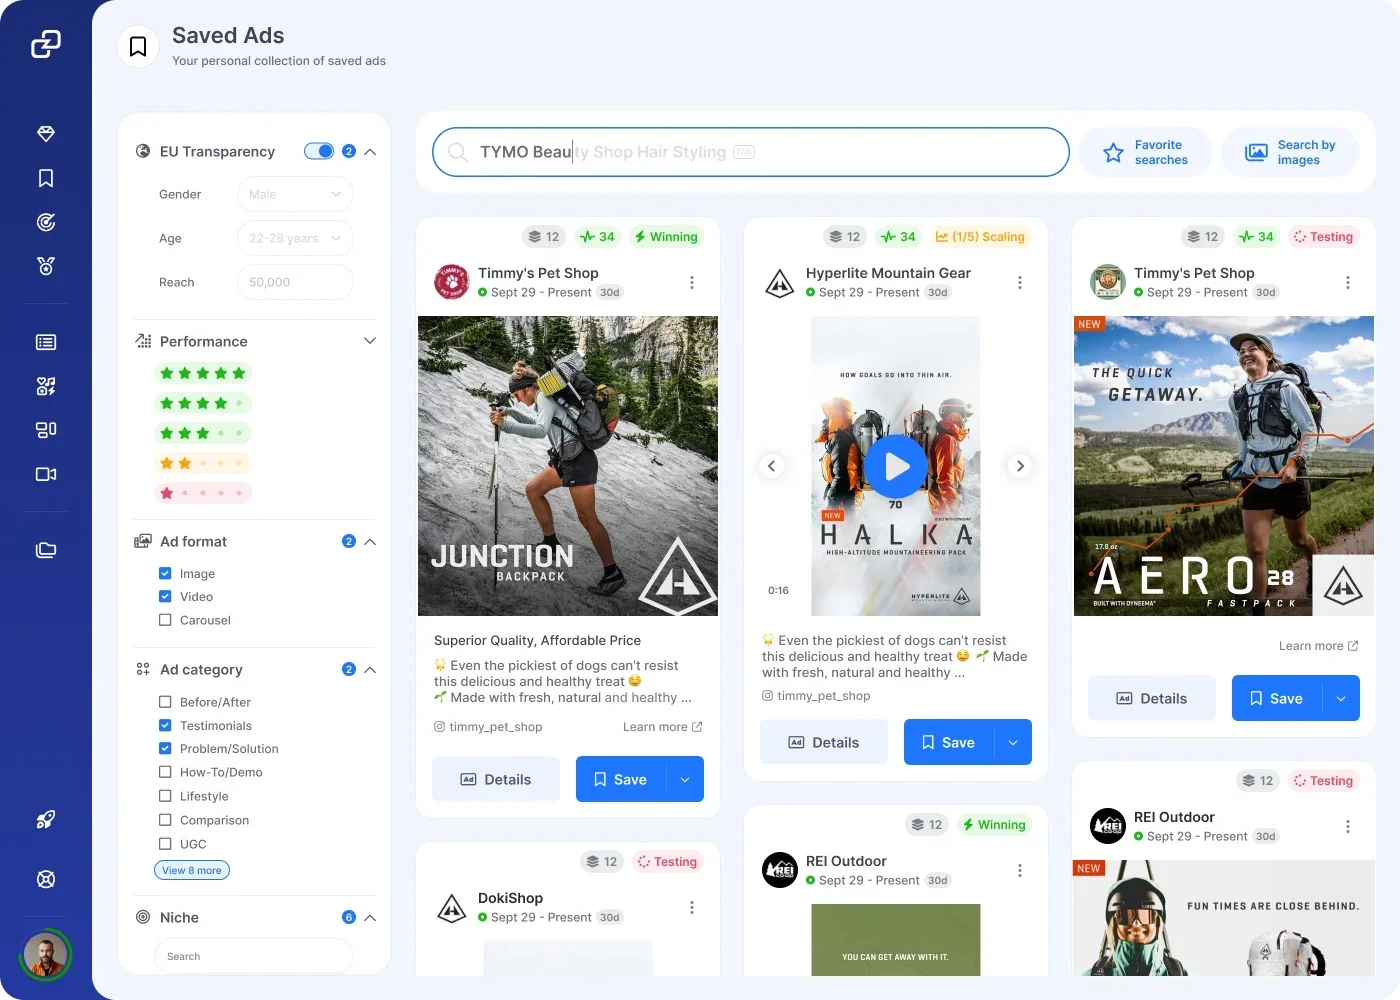
At GetHookd, we built our platform to make that next step straightforward. Our Brand Spy and Creative Analyzer surface the hooks and formats actively scaling across 65 million Meta ads, so your creative decisions start from evidence. Start your free GetHookd trial to see what your competitors are scaling right now.
Start your free GetHookd trial today.
Frequently Asked Questions (FAQs)
What is a good engagement rate for Instagram ads in 2026?
A good engagement rate for paid Instagram ads is 1%–2% by reach, with anything above 2% considered strong creative. The platform-wide average is roughly 0.48%, so clearing 1% on paid placements usually signals a healthy hook, on-brand format, and a well-targeted audience.
Does Instagram ad engagement rate affect Meta ad costs?
Yes. Meta rewards ads with strong engagement signals by lowering effective CPMs and prioritizing distribution in the auction. Weak engagement, especially low Reels retention, often drives CPMs higher and forces budget reallocation. Improving the first two seconds of a Reel is one of the highest-impact cost reduction moves available.
How often should I review competitor Instagram ads to improve engagement?
Review competitor ad activity at least weekly during active campaigns, and daily during product launches or major sales windows. Patterns shift quickly, and creatives that scaled six weeks ago may already be losing traction. Daily checks during peak periods catch new winners before they saturate your auction.
Do I need technical skills to use GetHookd for Instagram ad research?
No, GetHookd is built for media buyers, creative strategists, and agency operators, not developers. You can pull Instagram ad insights, generate AI scripts, and clone winning creatives directly inside the GetHookd interface without writing code, configuring scrapers, or managing APIs.
What does GetHookd Brand Spy do, and how does it support Instagram ad engagement?
GetHookd Brand Spy tracks which Instagram ads your competitors are actively scaling, along with the landing pages and traffic sources behind those campaigns. GetHookd uses this intelligence to surface proven hooks and formats that already drive engagement, so you can adapt the patterns into your own tests with far less creative guesswork.
*Note: Pricing and/or product availability mentioned in this post are subject to change. Please check our website for current pricing and stock information before making a purchase.