
Key Takeaways
- The average ROAS on Facebook ads in 2026 is about 1.86x, meaning most brands earn roughly $1.86 for every $1 they spend.
- Returns shift a lot by industry: Automotive leads at 2.54x, helped by the lowest CPM on the platform, while Media & Publishing trails at 1.17x.
- Three factors explain most of the spread: reach cost (CPM rose about 20% year over year), average order value, and conversion rate. Two brands spending the same can post very different ROAS purely on margins and price points.
- Treat these medians as a reference point, not a target. Your own break-even ROAS, set by your product margins, decides what actually counts as good.
- Since the fastest way to lift ROAS is rebuilding what already works, GetHookd lets you spy on the ads and funnels competitors are actively scaling in your industry, then turn those proven angles into testable creative before you spend.
What Counts as a Good Facebook Ads ROAS in 2026
A good Facebook ad ROAS in 2026 depends on your industry and your margins, but the platform-wide median gives a starting point. Across nearly 35,000 brands, the median Meta ROAS was 1.86x in 2025, a small gain over the prior year. Twelve of fifteen tracked industries improved, even as reach got more expensive. This figure comes from full-year 2025 reporting, the latest complete dataset available, and serves as the baseline heading in 2026.
A ROAS of 1.86x means a brand earned $1.86 for every $1 spent on ads. That figure only signals profit once it clears your break-even point, which your product margins set rather than any benchmark. A brand with thin margins can lose money at 2x, while a high-margin brand can profit below it.
This is why chasing a fixed target like 4x can mislead you. The number that matters is the one your own unit economics produce, and the industry median simply tells you what similar brands are managing in the same auction.
It is also worth remembering that platform-reported ROAS tends to over-credit ads, so your true return is usually a little lower than the figure inside Ads Manager. Treat every benchmark as a directional signal, not a promise.


GetHookd: Turn Competitor Intelligence Into Your Next Winning Ad
GetHookd reveals which ads your competitors are actively scaling—not just running. Spy on their best-performing creatives, landing pages, and traffic strategies, then turn proven concepts into testable campaigns in seconds with AI-powered script generation and creative cloning.
What You Get:- ✓ Brand Spy to decode competitor ad strategies in real-time
- ✓ AI script generation and ad cloning for instant variations
- ✓ Performance scoring based on actual ad behavior, not vanity metrics
- ✓ Creative Analyzer to identify and scale your top performers
Facebook Ads ROAS Benchmarks by Industry
Your industry shapes what a healthy return looks like more than any platform average does. The gap between the top and bottom category is more than double, so comparing yourself to the overall 1.86x figure can be misleading.
Higher-ROAS Industries
Automotive posted the strongest ROAS at 2.54x, helped by the cheapest ad costs on the platform and a 16% jump in how often clicks turned into sales. Sports & Outdoors (2.28x) and Travel Accessories & Luggage (2.25x) came next, though the travel category saw fewer clicks convert even as more people clicked.
Apparel & Accessories, Home & Garden, and Baby all sat near 2.17x to 2.18x. These are high-volume consumer categories where visual ads tend to perform well. Automotive also lowered its cost per customer by about 6%, one of the bigger improvements in the data.
Mid-Range ROAS Industries
Toys, Art & Collectibles and Lifestyle & Boutique both landed at 1.93x, right around the overall average. Electronics sat close behind at 1.92x, kept afloat by an average order value near $104 that makes up for a high cost per sale.
Electronics is the most expensive category to win a customer on Meta, at nearly $49 per sale, so its returns depend on people spending more per order. These industries reward tight creative testing and careful budgets.
Lower-ROAS Industries
Several categories fell below the average. Books & Music came in at 1.65x, with Pets & Animals (1.58x), Beauty (1.57x), and Food & Beverage (1.56x) grouped close together. Health & Wellness hit 1.50x while paying the highest ad costs on the platform, near $20.70 per thousand views, which leaves very little room for error.
Media & Publishing trailed everyone at 1.17x, where a shrinking average order value means almost nothing is left between what comes in and what goes out on ads. Being below average does not mean being stuck, though. Food & Beverage and Pets & Animals each grew their ROAS by about 7% over the year, the two biggest gains in the data.

Why Facebook Ad ROAS Varies by Industry
Three things explain most of the spread. Reach cost is the first: CPM rose about 20% year over year across every vertical, so categories that lean on cheap awareness took the biggest hit. Health & Wellness had the sharpest CPM jump at nearly 38%, which pulled its returns down.
Average order value is the second. A category like Travel Accessories & Luggage can absorb a high cost per sale because each order is worth more, while low-ticket categories have little cushion. Conversion rate is the third, deciding how many paid clicks actually become buyers.
Add these up and two brands spending the same amount can post very different ROAS, purely because of margins, price points, and how crowded their auction is.
How to Benchmark Your Own Facebook Ad ROAS
Benchmarks help only when you read them against your own economics. Work through these steps:
- Find your vertical in the table below and note its median ROAS.
- Calculate your break-even ROAS by dividing 1 by your contribution margin. A 40% margin means a 2.5x break-even.
- Compare the two. If the industry median sits below your break-even, you need above-average performance to profit.
- Check the metric behind a weak ROAS. Low click-through usually points to creative, while strong clicks with weak sales point to the landing page or offer.
- Study the ads and pages competitors are actively scaling, then rebuild what already works into your own tests.
The last step usually drives the biggest gains, because a benchmark shows the target while competitor creative shows how to reach it. The table below gives you the median ROAS for each vertical so you can find your own starting line at a glance.
2026 Facebook Ads ROAS Benchmarks by Industry: Summary Table
| Industry | Median ROAS (2026) |
| Automotive | 2.54x |
| Sports & Outdoors | 2.28x |
| Travel Accessories & Luggage | 2.25x |
| Apparel & Accessories | 2.18x |
| Home & Garden | 2.18x |
| Baby | 2.17x |
| Toys, Art & Collectibles | 1.93x |
| Lifestyle & Boutique | 1.93x |
| Electronics | 1.92x |
| Books & Music | 1.65x |
| Pets & Animals | 1.58x |
| Beauty | 1.57x |
| Food & Beverage | 1.56x |
| Health & Wellness | 1.50x |
| Media & Publishing | 1.17x |
| Platform-wide median | 1.86x |
Turning ROAS Benchmarks Into Action with GetHookd
The main lesson from the 2026 data is that no single ROAS number is good on its own. A 1.86x return can be profitable for a high-margin brand and a loss for a thin-margin one, so the right target depends on your industry, your average order value, and a reach cost that keeps climbing. Benchmarks show where you stand against similar brands, but the real work is closing the gap between your current return and your break-even point.
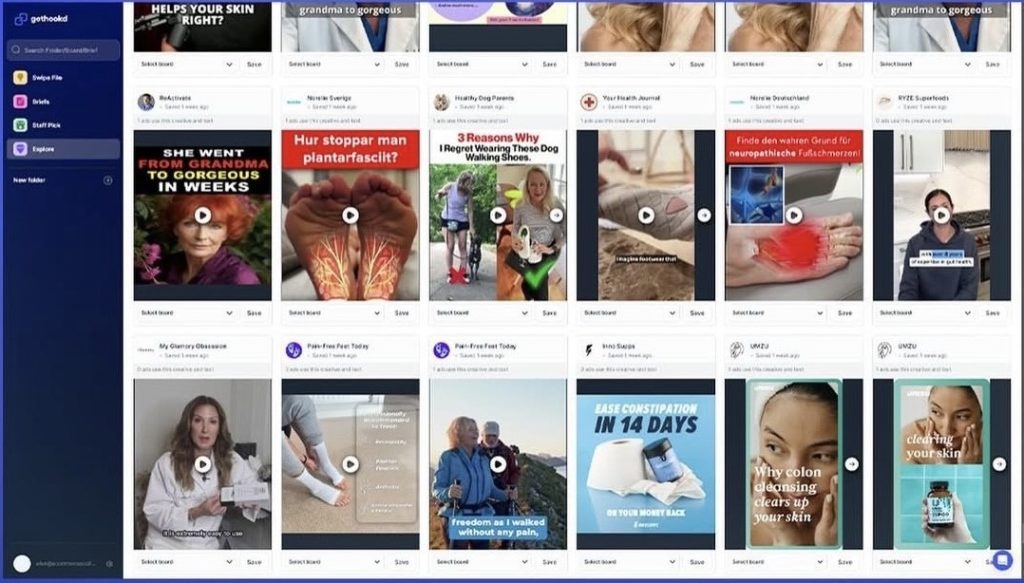
That gap tends to close fastest through better creative, which is exactly where competitor research earns its keep. At GetHookd, we show you the ads brands in your own category are actively scaling across Meta, then break those winners down into the hooks and formats you can test right away, so your spend goes toward angles with proof behind them instead of guesses. If your ROAS is stuck below your industry benchmark, find your next winning ad with GetHookd.
Frequently Asked Questions (FAQs)
What is a good ROAS for Facebook ads in 2026?
A good ROAS depends on your margins, but the platform-wide median is about 1.86x in 2026. Higher-margin brands can profit below 2x, while thin-margin sellers may need 3x or more before ads pay off.
Compare your result to your own break-even point and your industry median first, since the overall average blends categories that behave very differently.
Why did my ROAS drop even though my sales held steady?
Rising reach costs are the usual culprit. Meta CPMs climbed about 20% across every industry in 2025, so you can pay more to reach the same audience and watch ROAS fall while revenue stays flat.
Creative fatigue is the other common cause, since audiences stop responding to ads they have seen too often. Refreshing creative and tightening targeting are the fastest ways to recover.
How often should I check what competitors are advertising?
A weekly check is enough for most brands, with a closer look during launches or seasonal pushes. Ads change fast, and a competitor scaling a new angle is worth spotting early rather than months later.
Frequent monitoring helps you catch winning creative before it saturates the audience you share, which is when copying it stops working.
Do I need technical skills to research competitor ads?
No. Modern ad research tools are built for marketers, not developers, so you do not need coding or data know-how to use them.
You search a brand or niche, review the ads and landing pages surfaced for you, and save what looks promising to a board. The heavy lifting, including collecting and organizing the ads, runs in the background.
How does GetHookd help improve Facebook ad ROAS?
We help you spend on proven ideas instead of guesses. GetHookd surfaces the ads competitors are actively scaling across Meta, analyzes the winning hooks and formats, and turns them into testable scripts and cloned variations in seconds.
With a library of over 65 million ads and performance scoring built in, our tools point your budget toward creative with real evidence behind it, which is the surest way to lift ROAS above your industry median.
*Note: Pricing and/or product availability mentioned in this post are subject to change. Please check our website for current pricing and stock information before making a purchase.